Track Your Workouts
Use A Weight Training Dashboard For Better Results

Jun
I’ve made a dashboard to track website traffic, sales, etc. for every business I’ve owned. I also like to use the dashboard in Apple Fitness to check on my cardio workout results and progress. Some may call me a nerd for it but I’m always stoked when I see those metrics going up.
The one dashboard missing from my life was one for my strength training and HIIT workouts. I’d tried apps that have them but they weren’t so great. At most they showed how much weight I’ve lifted and number of workouts done.
I wanted more. Things like graphing my progress in terms of weight lifted and reps completed over time for every exercise and workout I’d done. It’s also important to know how much I’m training each muscle group and which exercises I do the most. Knowing these things will help me keep my workouts balanced and on track toward my goals.
Since I couldn’t find what I wanted I decided to make a weight training dashboard that has these features and more. It took a lot of trial and error but it’s done and I’m very happy with the results and how it’s helping make my workouts better.
You can have your own dashboard to help you see the results of every squat, swing, row, and curl you do too. All you need to do is read this article.
“The greatest value of a picture is when it forces us to notice what we never expected to see”
John Tukey
5 Reasons You Need A Weight Training Dashboard
A weight training dashboard helps you see your progress
While being able to look over the numbers from your workouts in a spreadsheet is great, being able to visualize the results of your workout is even better. Why? I’m not so sure. But it is. That’s why everyone from medical journals to your step counter app use tables, graphs, and charts to illustrate results. Seeing is believing, and understanding.
Think about it. Let’s when you look at the numbers in your spreadsheet that show how much weight you’ve squatted in a workout it’s hard see the amount of progress you’ve made. But, when this data is made into a graph it’s another story. Seeing the changes as a graphed line moving up and down really resonates.
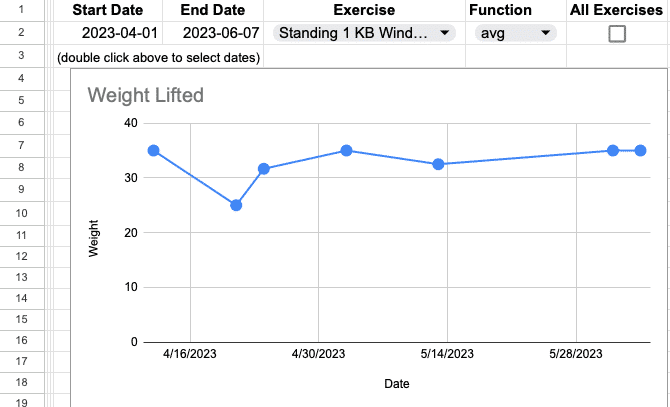
Take a look at the screenshot below. It’s from my strength training dashboard and shows the weight I’ve used for an exercise over 2 months. Being able to see my result like this helps me see when I’ve made the biggest gains. I can also see that it’s probably time to use a heavier weight to get the line back up and to the right.
Dashboards can help you stay motivated and consistent
Looking at my dashboard and seeing how my workouts are going is very motivating. Whenever I don’t want to workout I always check out my dashboard. I graph the progress for the exercises I’ll be doing next. Here’s how it helps me train when I don’t want to.
When I see a nice line going up and to the right for an exercise which shows I’m lifting heavier weights and/or doing more reps I get stoked to train and keep things moving on up. If the graph is more of a flat line or even going down it encourages me to get after it to turn things around.
Dashboards help you track progress toward your goals
Let’s say you want to be able to do 3 sets of 10 pull ups and you’re currently at 2 sets of 3. Being able to chart your progress from every workout and see your results is the best way to know if you’re on your way to achieving your goal or if you need to readjust your plan.
Identify areas where improvement is needed
While I hope the workout you do today is always better than the last, it’s probably not going to go that way. There are times when it does. But there’s also periods of weeks and months where you may not be making any type of improvement.
One way to turn around a lack of progress in the weight room is to see if you’re training the right muscles and exercises enough for your needs. Or training them too often.
Pie charts are my favorite way to do this.
Here’s an example. Let’s say your goal is to make your legs stronger. Problem is you’re not seeing your strength increase when you graph your results.
If you then make a pie chart to show what percentage of your workouts include leg focused exercises like squats and lunges you’ll see what’s up. If the chart shows you’re training legs at less than any other muscle group you’ll know that you probably need to increase that percentage for better results.
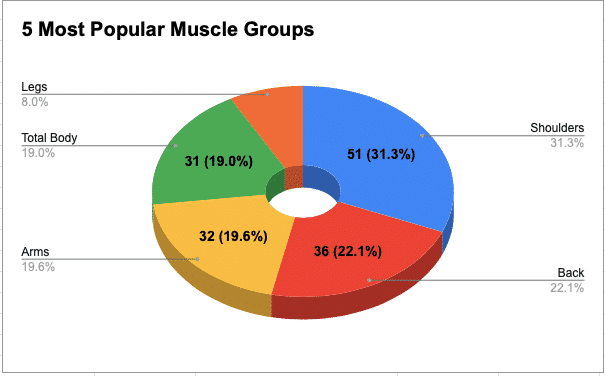
The pie chart below shows just that. I can clearly see that I may not be getting stronger legs since I’m only training 8% of the time. This wouldn’t be so easy to learn from a spreadsheet.
Compare your progress: different times, exercises, workouts, etc.
A good dashboard for weight lifting workouts will make it possible for you to compare your progress between exercises, workouts, etc. This will help you make changes to your workouts to help you stay on track and avoid plateaus and maybe even overuse injuries.
This could mean being able to see whether you’re getting stronger faster at pull ups or bent over rows. Another example is comparing whether switching lat pull downs for bent over rows is helping you do more pull ups.
“Once you know your goals you should measure your progress to achieve them. Seeing your favorable progress will serve as positive reinforcement to continue your hard work and seeing negative progress will alert you to something you should change to get you back on track.”
Jerry Brukner. Author of “The Success Formula For Growth”
What Your Dashboard Should Include
Here are 5 things that your strength training dashboard should include. With these you’ll be able to see what kind of progress you’re making right down to a specific exercise.
- How much weight you’ve lifted per workout for every exercise done.
- How many reps you’ve done per workout for each exercise.
- The total weight you’ve lifted per workout and over specific dates.
- The exercises you’ve done the most over time.
- What percentage you’re training different muscle groups.
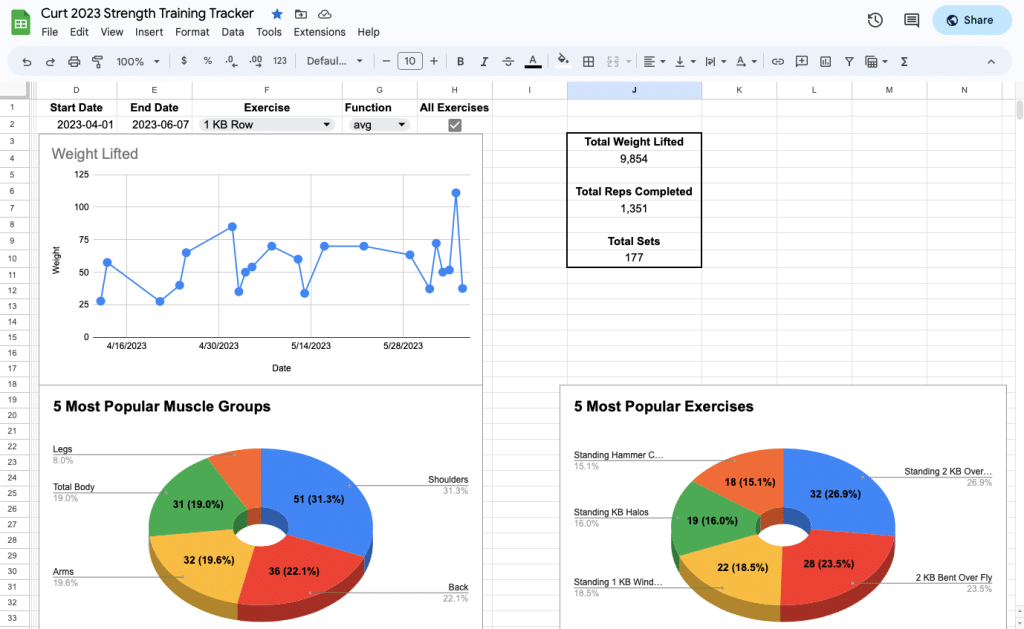
Here’s a screenshot of a weight training dashboard that shows each of these items.
Now I’m going to show you how to have your own weight training dashboard that shows these things and more.
Tips For Making Your Own Dashboard
Making a dashboard isn’t hard. If you are familiar with using spreadsheets to write formulas and make charts it’ll be simple. It’s not hard if you’re a total beginner either but will take some time to figure out.
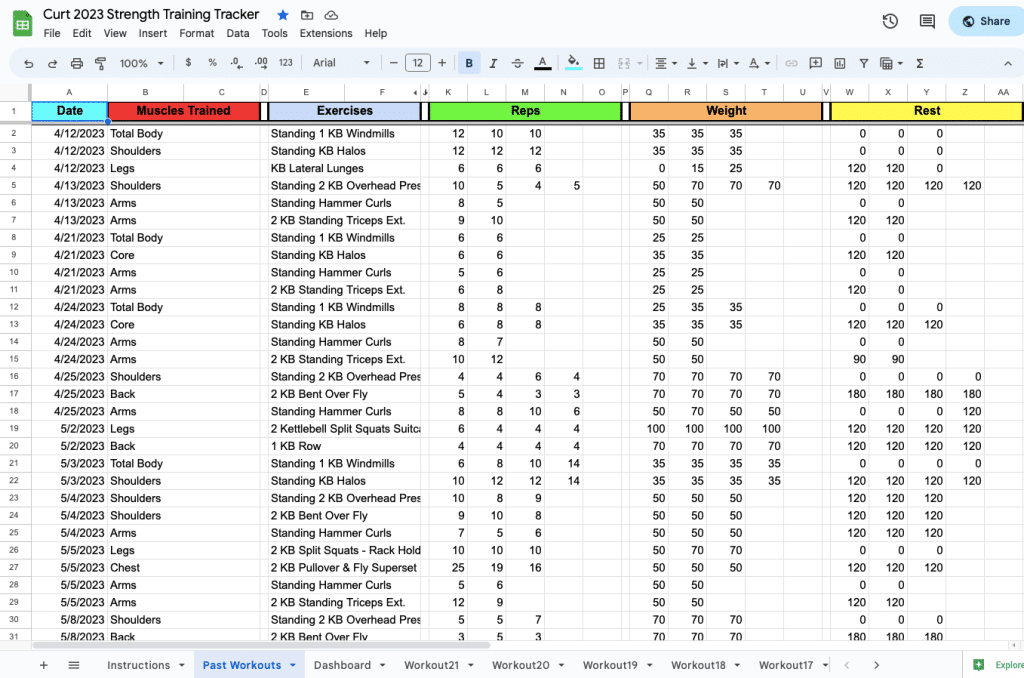
The most important tip I can give you is to create a single sheet where every set, rep, weight lifted, etc. is listed. This makes it much easier to create graphs, charts, tables and lists on your dashboard.
Below is a screenshot from the workout tracker I created. While each workout has it’s own sheet they’re all merged into one.
Check out this tutorial to learn how to make a dashboard
Here’s a link to a YouTube video by DMS Strength that shows you how to make a strength training dashboard. It’s what I used and I can’t recommend it enough.
You can also use the weight training dashboard I created
If you don’t want to make your own dashboard you should check out the weight training tracker that I made. It works as an add on to Google Sheets ™ and does stuff that no other app or spreadsheet tracker can to help you get the most from every workout.
Here are a few of the features the dashboard comes with.
- The total amount of weight you’ve lifted for every workout.
- The least, most, and average weight lifted for every exercise
- How many reps you’ve done per workout and for each exercise
- The 5 exercises you’ve done the most
- Which muscle groups you train most often
Best of all, if you want to add more functionality to the dashboard you can. Since the tracker saves all of your workouts in a database and uses the free Google Sheets ™ spreadsheet which is infinitely customizable it’s easy to create graphs and charts for every aspect of your workouts.
You get lots of other cool stuff that separates this workout log from all other spreadsheet trackers. This includes being able to make a new worksheet for a workout with a single click, automatically merging every workout into a database, and real time performance stats during your workout.
Here’s a screenshot of our tracker’s dashboard.
Start Using A Weight Training Dashboard Today
You now have all of the information needed to have a dashboard to fit your needs as part of your workout tracker. Whether you make your own or try ours, I know having one will help you see better results from every weight you lift, curl, press, and squat, and row.