Workout Tracker
Graph Your Weight Training To See Your Progress

Jul
For years I thought it would be really cool and helpful to graph my weight lifting workouts. Once I started doing so by building a workout dashboard it helped me see and have a clear view of what was working and what needed changing with my workouts.
Listed below are the ways graphing and charting my workouts helps me. I think it’ll do the same for you.
The Benefits Of Graphing Your Weight Lifting Progress
Positive Feedback And Motivation
When you see the lines on the graph going up and to the right you can see for yourself that you’re making progress. This feels great. It also tells you that you’re on the right track. You can’t help but feel energized and ready to keep pushing yourself in the gym.
Overcome Plateaus And Problems So Your Progress Doesn’t Stall
When you’ve lifted weights for a while a stall in progress and other similar bumps in the road are bound to happen. Examples are being stuck at 10 pull ups or not adding a single pound to the bar whenever you squat.
When left unchecked this can persist for weeks or months. This is super frustrating and can kill your motivation to train.
But, when you can graph your progress to see what’s up, plateaus can be spotted early on so they can be quickly overcome by changing up exercises, adjusting the weights, or whatever else you think will help.
Goal Setting
Being able to see where you are with your strength levels makes setting and achieving your lifting related goals much more likely.
This is done by looking at your graphs and charts to see exactly where you are at the moment and how far you need to go. If the line of your graph for an exercise is going straight up and to the right you set your goal a little higher.
On the other hand, if your progress has flatlined or even caused your graph to drop down you’ll know that you have to make adjustments to your workout so that you can still accomplish your goal.
With a graph, you can see your current trajectory and set future targets based on real data. It’s like having a personal fitness time machine!
Celebrating Your Accomplishments
Your weight lifting graphs are more than just lines and numbers. They’re a visual representation of your hard work, consistency, and progress. Being able to look back at where you started and how far you’ve come is a lightning bolt of inspiration that’ll keep you going through the good and bad workouts.
So remember, it’s not just about pushing yourself until your muscles burn and your heart is pounding out of your chest. You also need to take a break to graph and check on your progress. It’ll help you plan better workouts and keep you moving toward accomplishing your goals.
Keep reading. I’m going to tell you everything you need and show you how to make graphs and charts of your workouts.
How to graph weight lifting workouts
Step 1: What Info You’ll Need To Graph Your Workouts
- The Date
This is a simple but crucial data point. Tracking the date of each workout lets you see your progress for exercises and workouts at specific dates and over time. It also makes it possible for you to graph the total weight lifted and volume of entire workouts for specific dates. I discuss this more in the next section of this article.
- Every Exercises You’ve Done
By listing every exercise you can group them together along with the information from the 2 categories below. This enables you to graph everything you’d ever need about each exercise.
- Which Muscles Each Exercise Targets
I group them into 7 categories: arms, back, chest, core, shoulders, and total body. Since most exercises don’t train one muscle, choose the group it works the most.
Here’s an example. Overhead presses train your triceps, core, and upper back. But it’s primarily a shoulder exercise so that’s the group to use.
Total body exercises are those that train all of the large muscles pretty evenly. Think Turkish get ups, kettlebell snatches and cleans, thrusters, windmills, and overhead squats.
- The Sets and Reps Completed For Each Exercise
When graphed together and alone, your sets and reps are a good way to measure your strength-endurance and how you’re recovering. Each needs to have its own column on your spreadsheet.
- The Amount Of Weight You Lift
This is a direct measure of your strength. By recording the weight used in each session, you can clearly see increases over time, which is the ultimate goal of weightlifting.
- How Much You Rest Between Sets
Use a stopwatch or timer on your watch to keep track of the time you take between sets. Make a column for this information for every set of each exercise.
You don’t have to limit your tracking to the categories above.
Depending on your interests, needs, and goals you may also want to track your: heart rate recovery and max heart rate, pre-workout readiness, mood during and after training, how much sleep you’re getting, what you’re eating, etc. You’ll be able to graph this information and compare it to your workout data. This helps you see how these other factors may be helping or hurting your workouts.
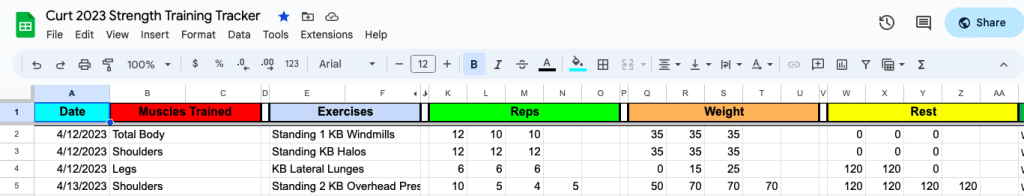
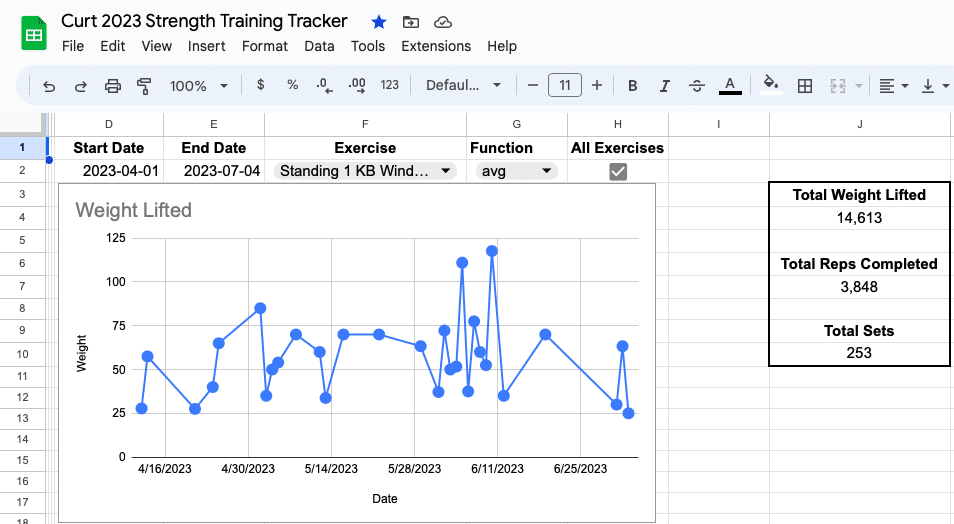
Below is a screenshot which shows you how to organize this date in one place. Once you have this information making a graph can easily be made in a few minutes.
You now know what information is required to track your workouts with graphs, charts, and tables. Let’s move on to the next section which will track you to actually make them.
Step 2: Put All Of Your Workout Data In One Place
Now that you know what info you’ll need you can collect it and organize it.
Make sure you keep all of it together on a single spreadsheet or page in your notebook. Give every item its own column. Record it all after every workout so nothing is forgotten.
Doing this is very important. It’s the best way to analyze, compare, and display your workout information as a graph or chart. Whether you use a computer or pen and paper. If you don’t it’ll take you 10 times as long to do.
I built a workout tracker that collects and merges all of your workout information together automatically. It also makes graphs, tables, and charts to help you see how you’re doing. Click here to see what I mean.
Okay, now that you know where to put your workout info let’s get into what information you need.
The Types Of Graphs You Can Make
Here are several things that can be graphed using your workout data. You can make these graphs several ways. I prefer to use a spreadsheet. Specifically Google Sheets ™.
I use it because there’s no faster way to make any type graph or chart that I want. It’s also easy to automate the process so all you need to do is keep your workout log up to date.
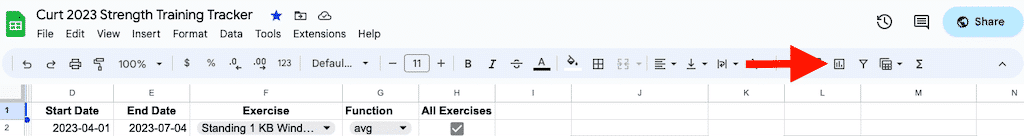
All you need to do is click on the ‘create chart’ button and fill out a form. Here’s where the button is on the Google Sheets toolbar.
- Progress of Individual Exercises
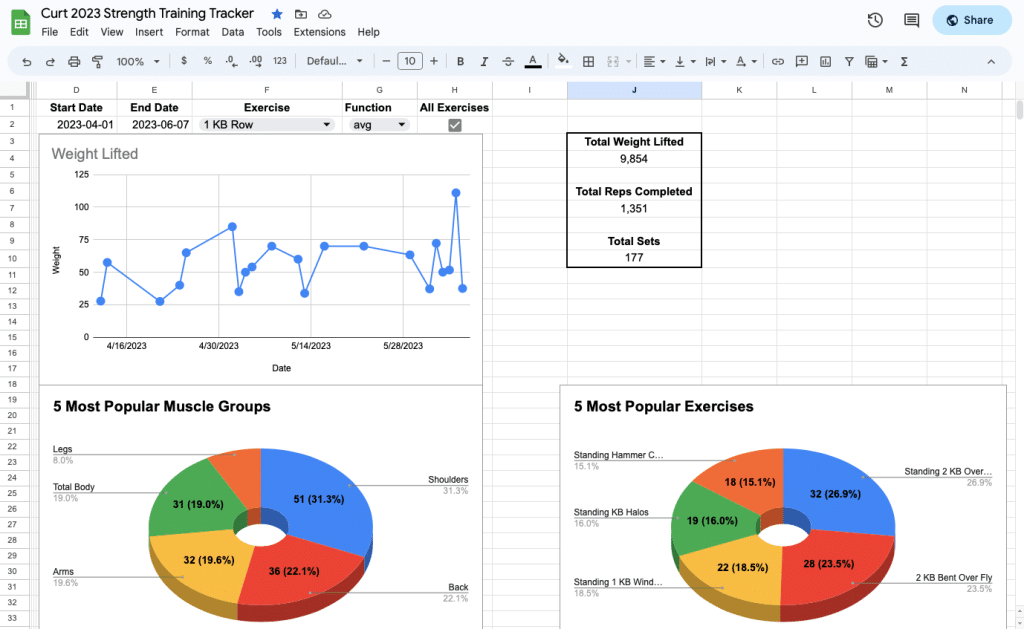
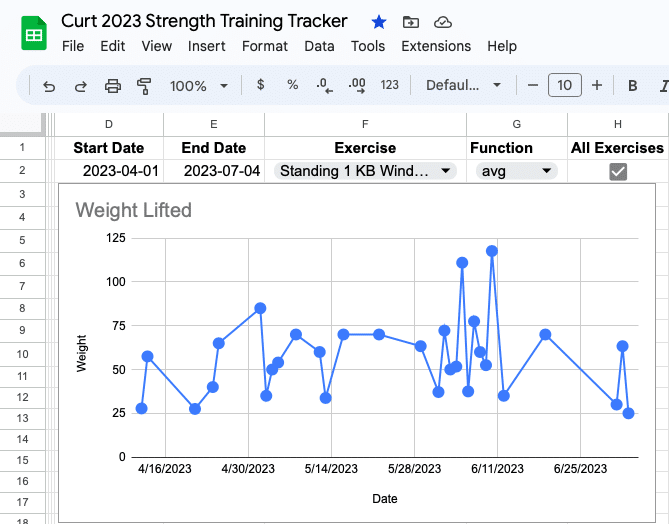
This graph shows the weight lifted for specific exercises over time. Seeing your strength increase in a specific exercise, like the bench press or squat, is incredibly motivating. It gives you a clear picture of your progress and allows you to see your progress from workout to workout.
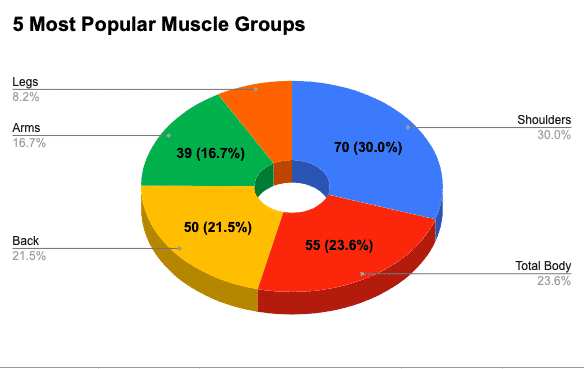
- Muscle Groups You’ve Trained
Grouping your exercises by the muscles they target makes it possible for you to make a pie chart that shows how often you’re training each which you may be training too much, or too little. This chart helped me recently. I saw I was only training my legs at 17% of my workouts. So started doing more leg exercises right away. If I hadn’t seen this it would’ve taken me a lot longer to learn and take action. This helps ensure a balanced training program and can highlight areas where you might need to focus more.
- Total Weight Lifted per Workout
This would show the sum of all weights lifted in each workout session over time. This can be a great measure of your overall strength and endurance and can help you see if you’re maintaining a consistent workout volume.
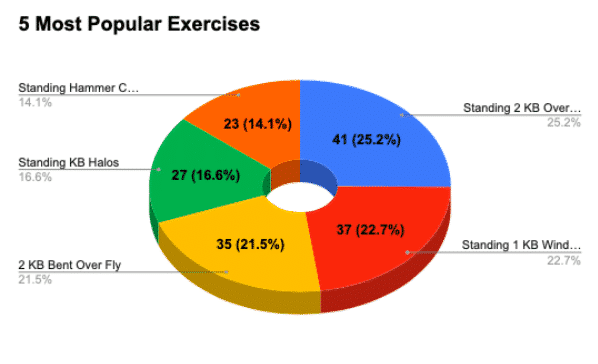
- Most Popular Exercises
This graph shows the 5 exercises you’re doing the most. Use this to see if you are doing the right every exercise often enough. This really helps keep your workouts balanced and on track.
By routinely reviewing these graphs and charts, you’ll be taking a data-driven approach to your workouts. This makes staying on the right path much easier than playing it by ear and guessing your way through things.
Why You Should Use Google Sheets To Make These Graphs
I’ve been using this free spreadsheet app for several years to track my workouts, run my business, and more.
Here’s why it’s better than other spreadsheet programs and workout apps
- You can access your workouts from any computer, phone, or tablet with Internet access.
- It’s free. All you need to get started is create an account with Google. If you use Gmail ™ you already have one.
- It’s easy to learn. But still super powerful. You can even write formulas and code to automate creating graphs and charts.
- Your information is always safe and secure. Stored in the cloud on Google’s servers you’ll never lose or throw your information away.
- Infinite customization. The more I track my workouts and build trackers with Google Sheets ™ the more I see that there’s not much you can’t get it to do. From custom colors to complex scripts to turn your tracker into an app, Sheets ™ does it all.
Create Your First Weight Training Graph Today
In this article I’ve given you all the information you need to make several graphs and charts that track every aspect of your workouts. They don’t take long to make and are invaluable for helping you get the most from every press, squat, row, and curl you do.